

Save your soul !
My first introduction into Design Thinking came due to my professional commitments. My previous company, specialized as an innovation management software company, exposed me to the creative radiation of this kryptonite. Thus helping me transform from the spectacled Clark Kent , to a red-caped flying Data Scientist with super-powers in strategic innovation and data analytics.

Having worked in this field of data science for more than 2 years, I figured out that the greatest challenge to me was trying to understand “The Business Problem” and chain it to “The Business Value”. Very often I was building interesting models and algorithms, but bridging them more proactively into a business value were being the bottlenecks.
The marriage between Data Science and Business Value was becoming like a sinking ship, and during some therapeutic sessions with Dr.Design Thinking who advised us to look into the marriage with a fresh pair of creativeness, we found new ways to spice up our lives.
What is Design Thinking ?
Design Thinking is an iterative process in which we seek to understand the user, challenge assumptions, and redefine problems in an attempt to identify alternative strategies and solutions that might not be instantly apparent with our initial level of understanding.
It systematically extract, teach, learn and apply these human-centered techniques to solve problems in a creative and innovative way — in our designs, in our businesses, in our countries, in our lives !
The essence of design thinking lies with the fact that you diverge at the starting of a phase and converge at the end of it.
The Framework
The framework as shown below follows the steps Empathize -> Ideate -> Prototype -> Implement sequentially, allowing a very linear data driven approach to solve a problem from a persona’s point of view.
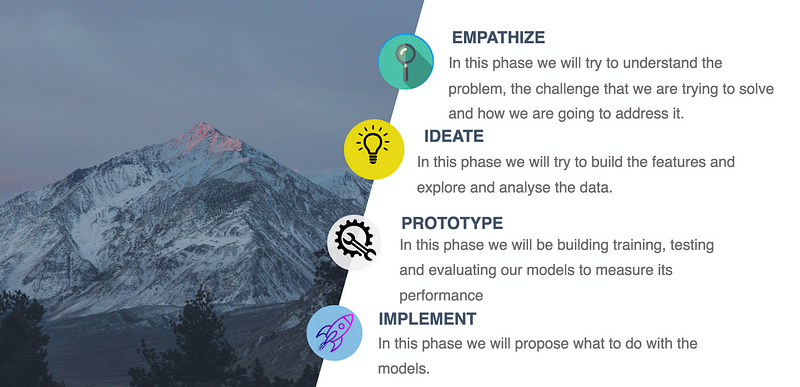
I. Empathize: “Feeling Good !”
The first step in the framework is about asking the right questions. This involves introspecting regarding the features of the dataset, what it denotes, what am I trying to solve and which features make sense into solving this problem, etc. It is necessary to keep asking why until you are satisfied with the answers.
For example with the titanic dataset from Kaggle, following are the features:
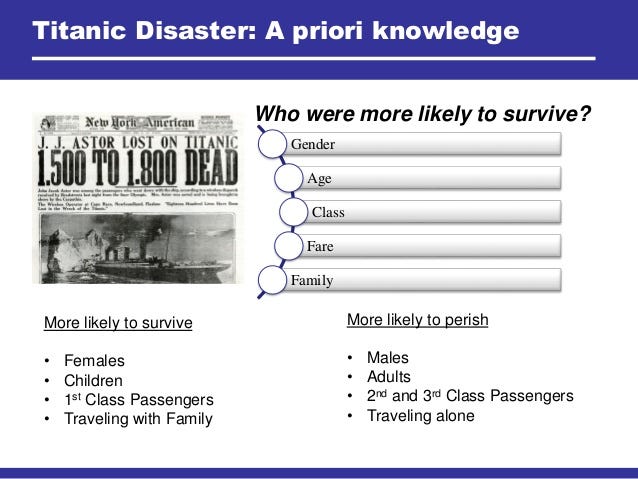
PassengerId, Survived, Pclass, Name, Sex, Age, SibSp, Parch, Ticket, Fare, Cabin,Embarked
When trying to solve the titanic survival rate problem with the above features, we can straight away point out that the survival probability of a person is not related to their given name (assumption that the names represent individuals without their titles, meaning, a person with a title Sir.Roger Waters will have higher chances of survival in comparison to Mr.Roger Waters due to their socio-economic status).
At this first stage, it is extremely important to be in the shoes of the user to try and understand how your survival rate would have been influenced and which factors will play the most important roles if you were on the ship.
Build an user type, and try to correlate the various features to it.
For example, user type or personas for the titanic problem can be like, Kate Winslet and Leonardo Di Caprio. What are the odds that Di Caprio will survive and try and explore the features associated to him (price of ticket paid, cabin class he was in, number of siblings, etc). The same thing can be applied to Kate and for the other members as well. Its the user profile building to a journey that is crucial in identifying the problem.
When you have an understanding of your dataset with all possible questions asked and answered, its time to formulate your main objective function, or in other words, the business question that needs to be solved.
II. IDEATE !
If at first the idea is not absurd, then there is no hope for it.
Albert Einstein
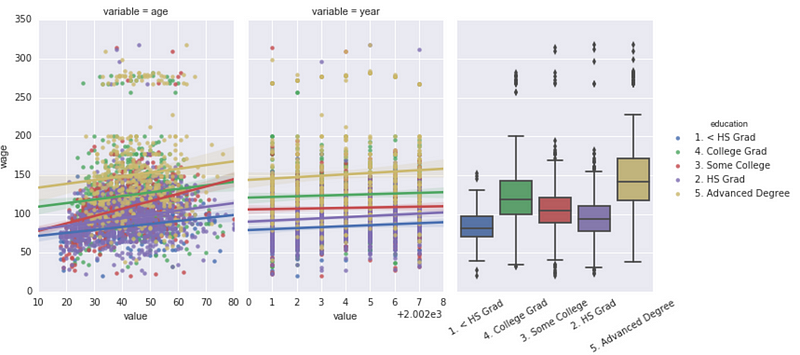
In Ideation phase, this is the part where things starts to become a bit messy. In this phase, I propose to dig deeper into the various intricacies of the data and try to look for hidden patterns and insights.
This phase involves cleaning the data, identifying missing values and using imputations to replace them. Following the cleansing, plotting the distribution of the data is recommended. This will give us an idea of the distribution of the various features with respect to the central limit theorem. Plotting heat-maps of correlation matrix is also very helpful as they tend to portray the inter-relationship between the features. Hypothesis testing is also done here between different groups to gauge their significance and impact.
Box-plots, bar-plots, histograms and line charts are some of the best visuals that can be applied in this context for plotting the distributions.
The next step in this phase should be applying encoding and binning techniques (more of preprocessing techniques to prepare the dataset). Encoding is mostly required for categorical data as computers are unable to understand them. Binning and feature modifications are also done in this step to go one dimension deeper in order to find some interesting clues. Encoding is needed since textual data is most of the time encoded to give them a platform for representation.
III. Prototyping: “Making your ideas converse !”
In this penultimate step of the framework, we will try to build our machine learning and A.I models keeping the objective function that we derived in “Empathize”.
We have to understand if its a regression problem that we are trying to solve or a classification problem. Are we trying to improve the loss function or the improve the cost function.
Before building the model, we have to make sure which features are the most important for the business case. Choosing low impactful features would result in the model being weak and performing terrible. Once we have carefully chosen our features, we can start to select various algorithms for the model. The target variable (for supervised machine learning) should be in sync with the objective function that we are trying to solve.
The evaluation of the models can be done using K-Fold Cross Validation technique and confusion matrix can be plotted to determine the performance of the models. Quite often you might have to run into an imbalanced class problem where oversampling and under sampling techniques have to be used to balance the classes and re-run the evaluation to gauge their performances.
IV. Implement: “ Rome was not built on a day”
As we come to the last step of the framework, this is the part where we test our newly born prototype.
We try to look back and see if the previous steps are linear enough to build a story because all products needs a story !
A/B Testing setup to deploying the models should be mostly done in this step.
In implementation we try to answer the business questions and check if our model is able to solve the user defined problem!
If not, restart until you converge !
Happy designing !
** An example of a case study that I solved applying the above framework, https://github.com/agnirudrasikdar/tv-demographics/blob/master/case_study.pdf

